All figures are in United States dollars unless otherwise stated. This news release contains forward-looking information that is subject to risk factors and assumptions as set out in the “Cautionary Note Regarding Forward-Looking Information” below.
TORONTO, Feb. 19, 2026 (GLOBE NEWSWIRE) -- Centerra Gold Inc. (“Centerra” or the “Company”) (TSX: CG) (NYSE: CGAU) announces its 2025 year-end estimates for mineral reserves and mineral resources. Proven and probable gold mineral reserves increased 58% year-over-year to 5.5 million ounces, and proven and probable copper mineral reserves increased 49% year-over-year to 1.7 billion pounds, as of December 31, 2025. Measured and indicated gold mineral resources inclusive of reserves were 10.8 million ounces and measured and indicated copper mineral resources inclusive of reserves were 3.6 billion pounds, as of December 31, 2025.
In 2025, Centerra continued to advance its organic growth pipeline and updated its mineral reserves and mineral resources estimates for the Goldfield project (“Goldfield”), the Mount Milligan mine (“Mount Milligan”) and the Kemess project (“Kemess). As a result, the 2025 year-end mineral reserve and mineral resource estimates for these assets are consistent with the figures disclosed in those respective technical updates with minor adjustments to Mount Milligan related to depletion in 2025 since the Pre-Feasibility Study (“PFS”).
Centerra Year-End Gold Mineral Reserves and Mineral Resources(1)
| 2025 | 2024(2) | |||||
| Property | Tonnes (kt) | Grade (g/t) | Contained Gold (koz) | Tonnes (kt) | Grade (g/t) | Contained Gold (koz) |
| Total Proven and Probable Gold Mineral Reserves | ||||||
| Mount Milligan | 470,332 | 0.28 | 4,294 | 264,512 | 0.33 | 2,826 |
| Öksüt | 15,355 | 1.02 | 503 | 20,080 | 1.03 | 662 |
| Goldfield | 33,348 | 0.66 | 706 | - | - | - |
| Total | 519,034 | 0.33 | 5,504 | 284,591 | 0.38 | 3,488 |
| Total Measured and Indicated Gold Mineral Resources, Inclusive of Reserves | ||||||
| Mount Milligan | 714,992 | 0.27 | 6,262 | 467,510 | 0.30 | 4,457 |
| Öksüt | 16,769 | 0.98 | 530 | 22,947 | 0.99 | 734 |
| Kemess Main - Open Pit | 170,513 | 0.30 | 1,668 | 111,682 | 0.27 | 980 |
| Kemess South – Open Pit | 13,204 | 0.37 | 158 | - | - | - |
| Kemess UG - Underground | 33,223 | 0.82 | 877 | 139,920 | 0.50 | 2,265 |
| Kemess East - Underground | 27,491 | 0.64 | 565 | 93,454 | 0.39 | 1,182 |
| Goldfield | 37,034 | 0.67 | 794 | 30,833 | 0.71 | 706 |
| Total | 1,013,225 | 0.33 | 10,855 | 866,346 | 0.37 | 10,324 |
| Inferred Gold Mineral Resources | ||||||
| Mount Milligan | 27,901 | 0.37 | 334 | 27,924 | 0.44 | 395 |
| Öksüt | - | - | - | 236 | 0.88 | 7 |
| Kemess Main - Open Pit | 237,050 | 0.30 | 2,299 | 13,691 | 0.26 | 116 |
| Kemess South – Open Pit | 198 | 0.34 | 2 | - | - | - |
| Kemess UG - Underground | 20,094 | 0.74 | 481 | - | - | - |
| Kemess East - Underground | 42,252 | 0.57 | 772 | - | - | - |
| Goldfield | 2,121 | 0.33 | 23 | 2,267 | 0.41 | 30 |
| Total | 329,616 | 0.37 | 3,911 | 44,118 | 0.38 | 548 |
(1) As of December 31, 2025. Refer to the Table “Centerra Gold 2025 Year-End Mineral Reserve Summary” and “Centerra Gold 2025 Year-End Mineral Resource Summary” including their respective footnotes and the “Additional Footnotes” section below.
(2) Mineral resources inclusive of mineral reserves, as of December 31, 2024, is for comparative purposes only. See 2024 year-end mineral reserves and resources news release dated February 20, 2025, for mineral resources exclusive of mineral reserves as of December 31, 2024.
Centerra Year-End Copper Mineral Reserves and Mineral Resources(1)
| 2025 | 2024(2) | |||||
Property | Tonnes (kt) | Grade (% Copper) | Contained Copper (Mlbs) | Tonnes (kt) | Grade (% Copper) | Contained Copper (Mlbs) |
| Proven and Probable Copper Mineral Reserves | ||||||
| Mount Milligan | 470,332 | 0.17 | 1,716 | 264,512 | 0.20 | 1,150 |
| Total | 470,332 | 0.17 | 1,716 | 264,512 | 0.20 | 1,150 |
| Measured and Indicated Copper Mineral Resources, Inclusive of Reserves | ||||||
| Mount Milligan | 714,992 | 0.15 | 2,411 | 467,510 | 0.19 | 1,915 |
| Kemess Main - Open Pit | 170,513 | 0.15 | 575 | 111,682 | 0.14 | 337 |
| Kemess South – Open Pit | 13,204 | 0.13 | 38 | - | - | - |
| Kemess UG - Underground | 33,223 | 0.36 | 265 | 139,920 | 0.25 | 779 |
| Kemess East - Underground | 27,491 | 0.44 | 268 | 93,454 | 0.30 | 628 |
| Total | 959,422 | 0.17 | 3,556 | 812,566 | 0.21 | 3,659 |
| Inferred Copper Mineral Resources | ||||||
| Mount Milligan | 27,901 | 0.08 | 50 | 27,924 | 0.12 | 74 |
| Kemess Main - Open Pit | 237,050 | 0.13 | 682 | 13,691 | 0.16 | 48 |
| Kemess South – Open Pit | 198 | 0.08 | 0 | - | - | - |
| Kemess Underground - UG | 20,094 | 0.33 | 148 | - | - | - |
| Kemess Underground - East | 42,252 | 0.42 | 393 | - | - | - |
| Total | 327,495 | 0.18 | 1,273 | 41,615 | 0.13 | 122 |
(1) As of December 31, 2025. Refer to the Table “Centerra Gold 2025 Year-End Mineral Reserve Summary” and “Centerra Gold 2025 Year-End Mineral Resource Summary” including their respective footnotes and the “Additional Footnotes” section below.
(2) Mineral resources inclusive of mineral reserves, as of December 31, 2024, is for comparative purposes only. See 2024 year-end mineral reserves and resources news release dated February 20, 2025, for mineral resources exclusive of mineral reserves as of December 31, 2024.
Exploration Update
Exploration activities in the fourth quarter of 2025 included drilling, surface rock and soil sampling, geological mapping, and geophysical surveying, targeting gold and copper mineralization at the Company’s projects and properties in Canada, Türkiye, and the United States.
2025 Exploration Highlights
- The mineralization at Mount Milligan continued to expand to the west towards North Slope due to the significant drill intercepts at the Goldmark and Saddle West areas. During the year, a total of 56,835 metres of core drilling was completed across 200 holes. Drilling, model updates, and increased commodity prices resulted in an increase of approximately 2 million ounces of gold and 500 million pounds of copper to the mineral resource base.
- At Kemess, a total of 31,940 metres of drilling was completed in the Kemess Main and Kemess South open pit areas. At Kemess Main, drilling throughout the year was carried out to infill the resource within the Kemess Main open pit and the Kemess Underground as well as to bridge the gap between the Kemess Underground and Kemess East resource at the Offset zone. Results confirm the grade and extent of mineralization within the resource pit and within the Nugget and Kemess Main open pit areas, supporting local upgrades to the resource classification. Results for the Kemess Offset drilling also indicate the potential to delineate the resource at the Offset zone. Material within the Offset Zone is an unclassified resource and is not included in the Kemess Main mineral resource.
- At the Öksüt mine (“Öksüt”), 796 metres of drilling was completed during the first quarter of the year. In the United States, drilling at Goldfield and the Oakley project (“Oakley”) did not start until mid-December 2025.
- Full year 2025 drilling totalled 113.5 kilometres (“km”), including greenfield projects.
2026 Exploration Outlook
- Exploration expenditures in 2026 are expected to be $40 to $50 million, including $20 to $25 million of brownfield exploration focused on Mount Milligan, Kemess, and Öksüt, and $20 to $25 million of spending on greenfield and generative exploration programs.
- Centerra is expected to continue to explore the western extension of the Mount Milligan deposit and perform infill drilling to upgrade the inferred resources to the indicated category. Approximately 20% of the total 2026 exploration expenditures are allocated to drilling programs at Mount Milligan to upgrade the inferred resources between Goldmark and North Slope and to expand the resources at Saddle West and South Boundary areas.
- At Kemess, Centerra is expected to continue to perform infill drilling within the Preliminary Economic Assessment (“PEA”) resource areas and perform additional drilling to upgrade material at the Offset zone to inferred resources. Drilling is expected to continue to test the western extension of the Kemess South deposit. Approximately 15% of the total 2026 exploration expenditures are allocated to Kemess to drill approximately 14 km.
- Centerra is expected to continue to advance greenfield exploration projects around Mount Milligan, including Cauldron and the Syndicate joint venture projects in British Columbia and at the optioned-deal agreement projects in northwestern Ontario.
- In the United States, Centerra is expected to continue to explore for near surface oxide mineralization within the Goldfield district in Nevada and at Oakley in Idaho. Centerra is also expected to continue advancing exploration work at its greenfield projects, Cirrus in Nevada, Jones Creek in Utah, and at two new option-deal agreement projects in Idaho.
- In Türkiye, as part of a life of mine optimization study, work is underway at Öksüt to identify potential targets that will be drilled during 2026. Centerra is expected to continue drilling at the Ulu joint venture project and at other early-stage joint venture projects that were identified in 2025.
Mount Milligan
- In 2025, the Company increased its mineral resource inclusive of reserves by approximately 2 million ounces gold and 500 million pounds copper. The 2026 exploration drilling program at the site is focused on significantly expanding the mineral resource base to the west and southwest.
- In 2025, a total of 48,372 metres of infill drilling was completed across 169 drillholes, and 8,462 metres of brownfield exploration drilling was completed across 31 drillholes. Brownfield exploration focused on targets west of the current ultimate pit margins including the North Slope, Goldmark, Saddle West, and Boundary zones.
- The 2025 exploration drilling at Goldmark returned significant gold assay results from the upper portions of the holes and increased porphyry mineralization at depth, resulting in the extension of the resource shell towards the North Slope area.
- Drilling of the South Boundary area identified high-grade gold, low copper vein mineralization supporting a previous interpretation that the zone represents a gold rich cap of an underlying porphyry deposit, similar to the geometry of the 66 zone and the MBX stock. Continued drilling within the area has the potential to identify a gold-copper mineralization northwest towards the Boundary zone area.
- Approximately 20% of the total 2026 exploration expenditures are allocated to drilling programs at Mount Milligan to upgrade the inferred resources between Goldmark and North Slope and to expand the resources at Saddle West and South Boundary areas.
- Ongoing exploration continues to highlight the potential to further expand mineral resources and extend mine life beyond the updated 2025 PFS mine plan. Mount Milligan remains a strategic cornerstone asset in Centerra’s portfolio, with 20 years of mine life, meaningful low-cost gold and copper production, strong cash flow generation, and significant opportunity for future exploration potential in a top tier mining jurisdiction
Figure 1: Plan view of the Mount Milligan deposit showing the 2025 resource shell and reserve pit with planned 2026 drillholes
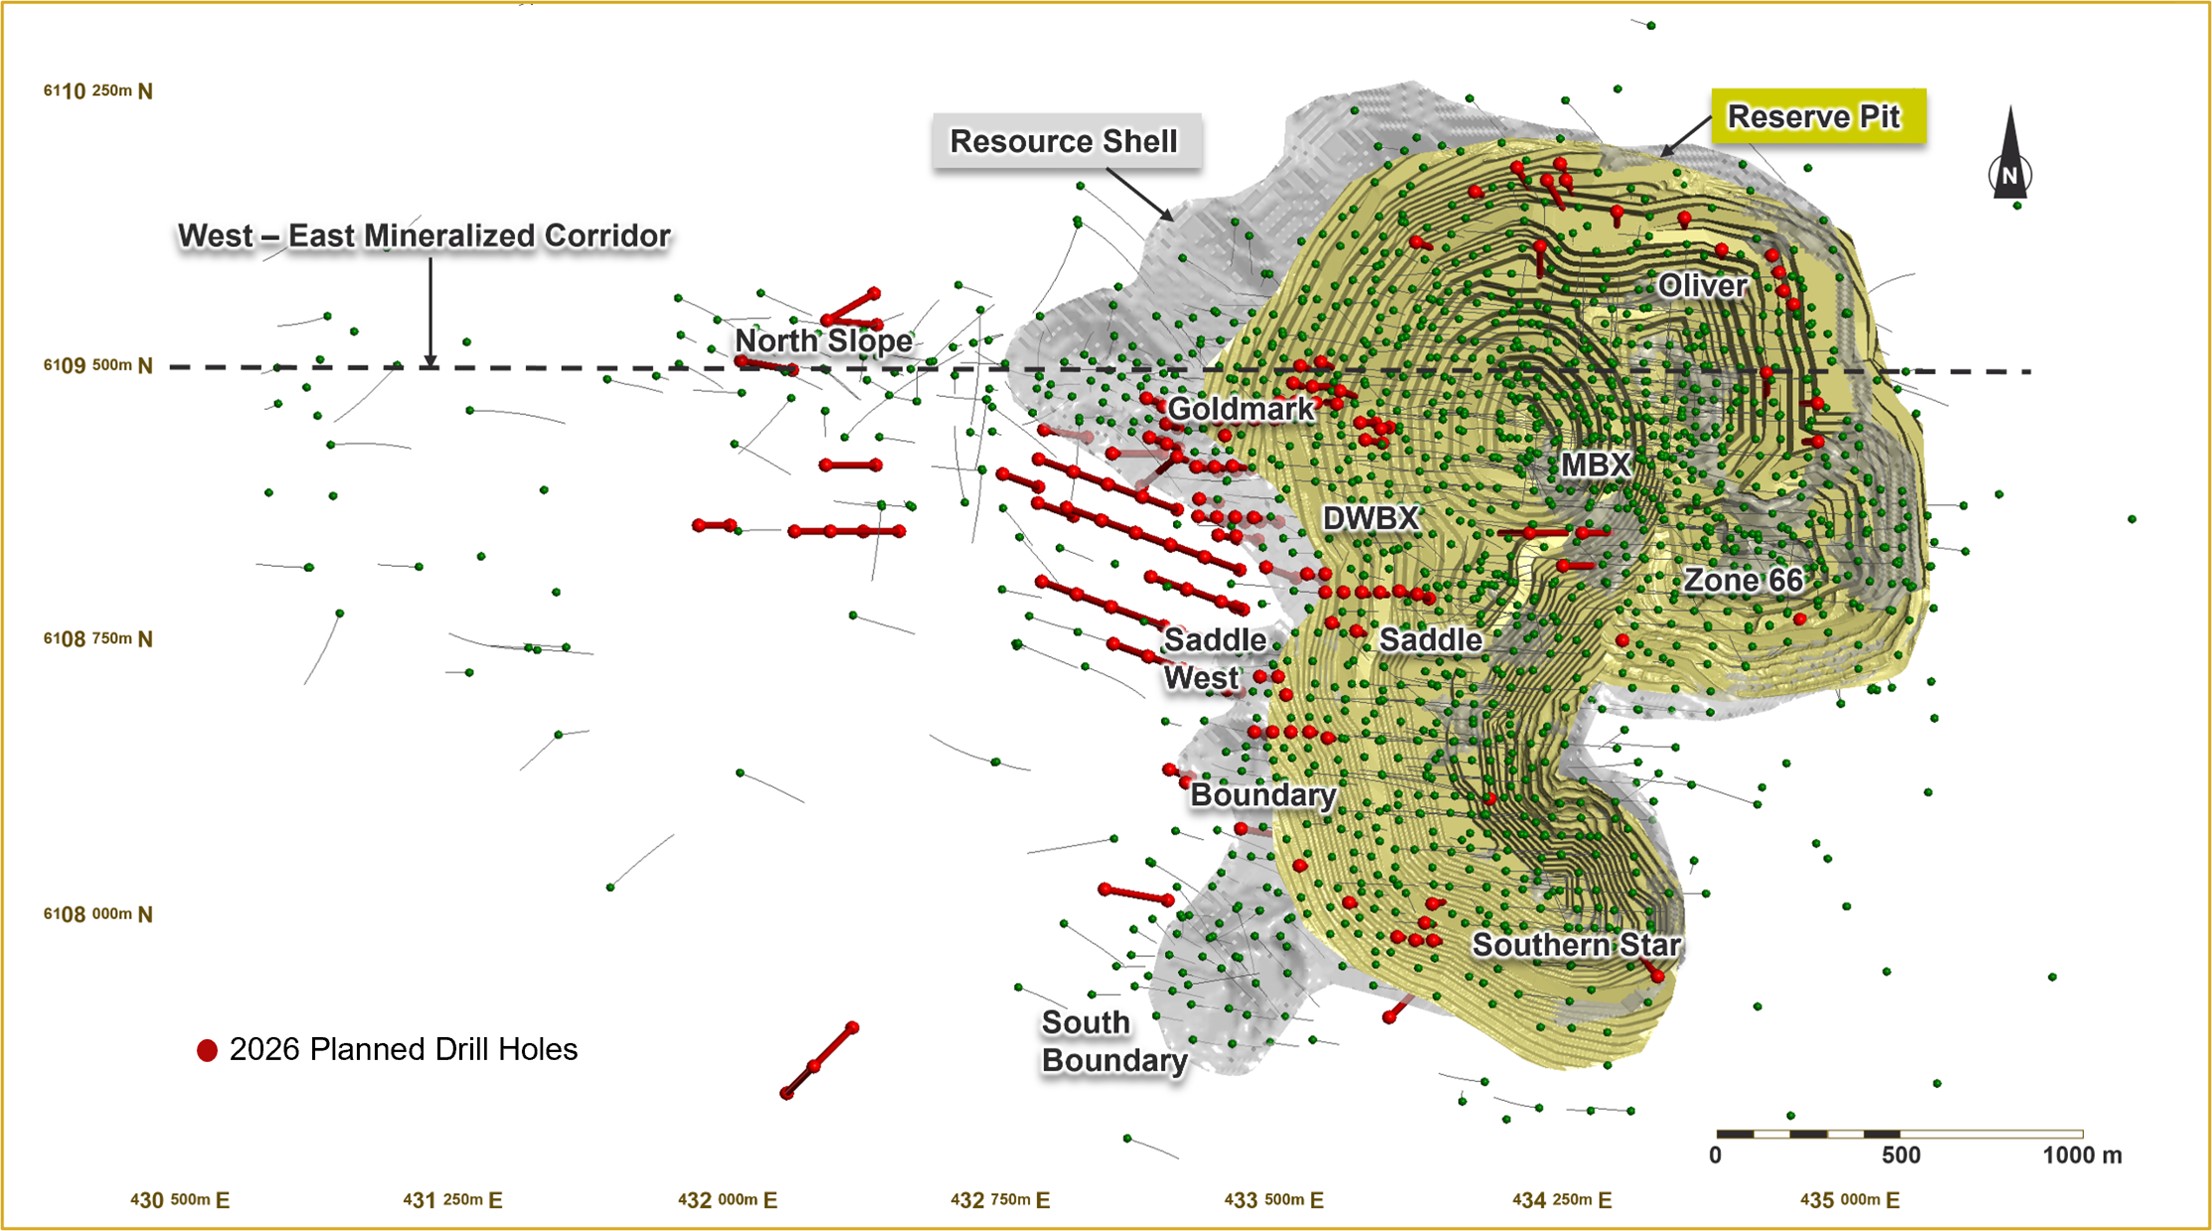
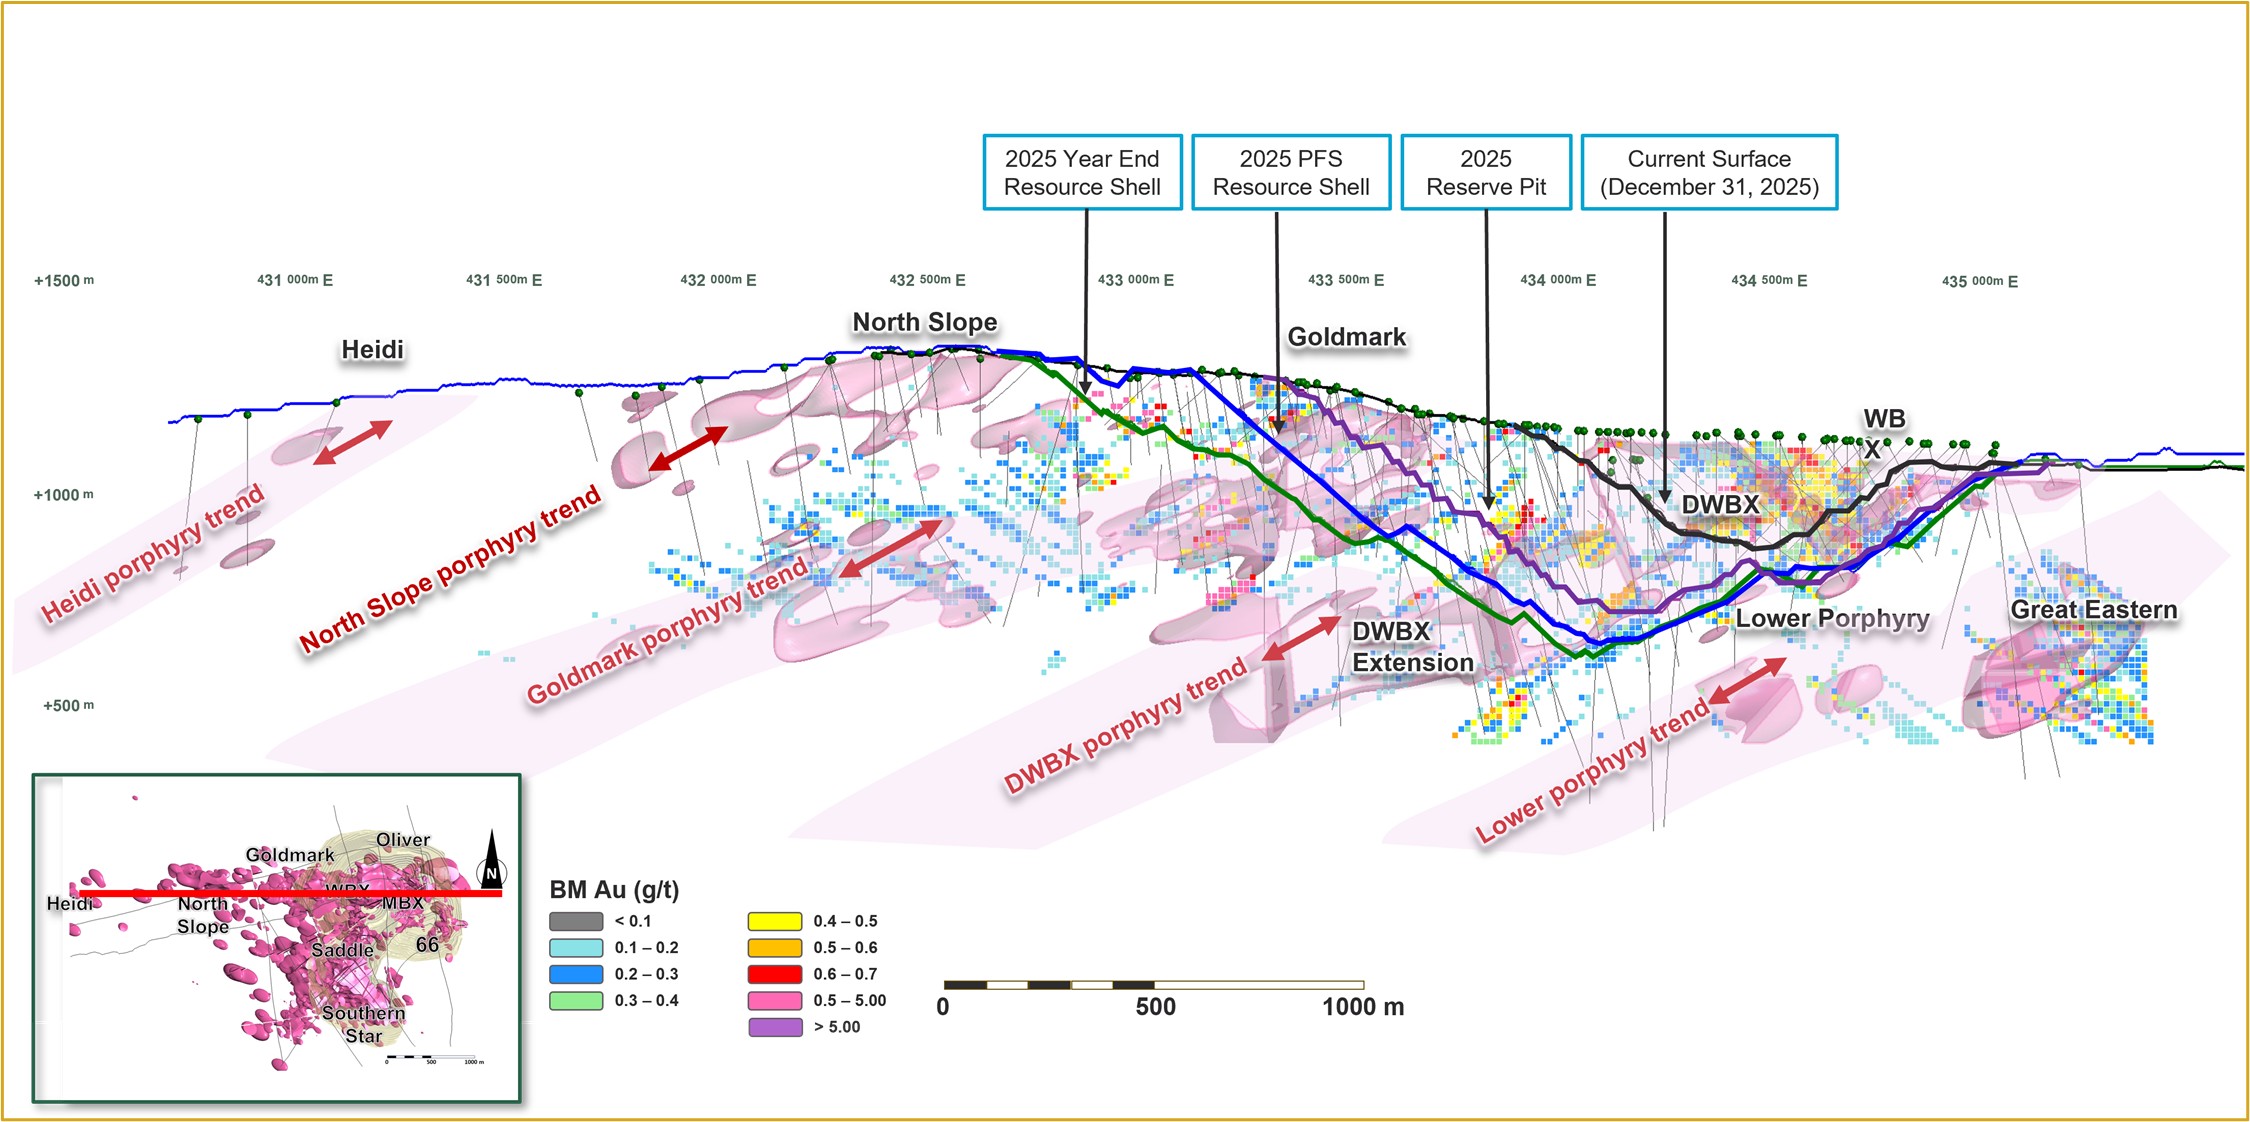
Figure 2: East-West cross section of the Mount Milligan 2025 resource shells and reserve pit (looking north), showing gold modeled blocks
The Goldmark zone is directly west of the current Mount Milligan pit design, situated above the high grade DWBX zone. In 2025, drilling continued to test and infill the western extent of the Goldmark mineralization that had been intersected in previous drill programs. Shallow porphyry-style gold and copper mineralization is hosted at the margins of dykes and the Goldmark stock. High gold-low copper (“HGLC”) style mineralization occurs throughout the zone above the gold-copper porphyry mineralization. The results show potential for shallow resource additions and the extension of mineralization west of the existing pit boundary. Significant results include:
Hole #25-1706: 17.0m @ 9.39 g/t gold ("Au"), 0.132% copper ("Cu") from 72 metres ("m")
Hole #25-1706: 42.0m @ 1.95 g/t Au, 0.154% Cu from 186m
Hole #25-1705: 48.3m @ 2.60 g/t Au, 0.176% Cu from 66.7m
Hole #25-1701: 42.0m @ 1.39 g/t Au, 0.100% Cu from 121m
Hole #25-1692: 24.0m @ 1.60 g/t Au, 0.142% Cu from 236m
Hole #25-1725: 2.4m @ 15.97 g/t Au, 0.075% Cu from 69.6m
Hole #25-1746: 12.0m @ 3.08 g/t Au, 0.184% Cu from 27m
Hole #25-1715: 66.8m @ 0.53 g/t Au, 0.192% Cu from 241m
Hole #25-1685: 23.0m @ 1.45 g/t Au, 0.475% Cu from 123m
Hole #25-1710: 98.9m @ 0.23 g/t Au, 0.217% Cu from 185m
The North Slope zone lies approximately 300 to 800 metres west of the Mount Milligan pit design, adjacent to the Goldmark zone. Assays show multiple localized shallow zones of HGLC style mineralization, with higher-grade porphyry-style gold and copper mineralization related to the North Slope stock intersected at depth. Significant results include:
Hole #25-1750: 10.0m @ 3.93 g/t Au, 0.077% Cu from 99m
Hole #25-1733: 24.0m @ 1.47 g/t Au, 0.061% Cu from 158m
Hole #25-1750: 49.6m @ 0.67 g/t Au, 0.03% Cu from 114m
Hole #25-1749: 3.0m @ 9.00 g/t Au, 0.304% Cu from 90m
Hole #25-1751: 12.0m @ 1.89 g/t Au, 0.086% Cu from 35m
Hole #25-1756: 24.0m @ 0.55 g/t Au, 0.045% Cu from 74m
Hole #25-1737: 9.3m @ 1.63 g/t Au, 0.034% Cu from 140m
Hole #25-1751: 7.3m @ 2.03 g/t Au, 0.018% Cu from 176m
The Saddle West (including King Richard) zone extends to approximately 800 metres west of the existing Mount Milligan ultimate pit boundary and south of the Goldmark zone. It is interpreted to be the down-dip extension of the Saddle zone in the central part of the deposit. Mineralization is associated with margins of monzonite porphyry dykes, and with transitional to late-stage veins with sericite alteration overprinting early-stage potassic alteration. Results show potential for shallow resource additions and the extension of mineralization west of the existing pit boundary. Significant results include:
Hole #25-1717: 81.7m @ 0.13 g/t Au, 0.214% Cu from 174m
Hole #25-1717: 35.8m @ 0.12 g/t Au, 0.142% Cu from 297m
Hole #25-1724: 61.0m @ 0.16 g/t Au, 0.136% Cu from 345m
Hole #25-1711: 42.6m @ 0.17 g/t Au, 0.122% Cu from 178m
Hole #25-1771: 12.0m @ 0.54 g/t Au, 0.071% Cu from 20m
Hole #25-1771: 28.9m @ 0.21 g/t Au, 0.101% Cu from 38m
The Boundary zone is directly south of the Saddle West zone and west of the Mount Milligan pit design within 200 metres of the current pit operations. Assays show both shallow and deep porphyry-style gold and copper mineralization in the shallow Boundary zone and underlying northwestern extension of the Southern Star composite stock. Mineralization is hosted within dykes and at dyke margins in potassic and within inner propylitic altered andesite tuffs, often overprinted by quartz-sericite-pyrite alteration, with early quartz veins and chalcopyrite ± pyrite veins. Results show potential for shallow resource additions and the extension of mineralization west of the existing pit boundary. Significant results include:
Hole #25-1770: 64.5m @ 0.44 g/t Au, 0.224% Cu from 117m
Hole #25-1767: 27.4m @ 1.00 g/t Au, 0.134% Cu from 37m
Hole #25-1767: 4.8m @ 4.79 g/t Au, 0.153% Cu from 69m
Hole #25-1767: 20.8m @ 0.39 g/t Au, 0.118% Cu from 216m
Hole #25-1763: 8.0m @ 2.18 g/t Au, 0.054% Cu from 294m
Hole #25-1763: 1.6m @ 9.02 g/t Au, 0.114% Cu from 83m
Hole #25-1755: 101.5m @ 0.18 g/t Au, 0.224% Cu from 455m
Hole #25-1755: 39.1m @ 0.28 g/t Au, 0.158% Cu from 83m
Hole #25-1755: 30.0m @ 0.36 g/t Au, 0.048% Cu from 222m
Hole #25-1765: 43.9m @ 0.23 g/t Au, 0.162% Cu from 307m
Hole #25-1765: 26.4m @ 0.31 g/t Au, 0.050% Cu from 259m
Hole #25-1765: 32.9m @ 0.19 g/t Au, 0.109% Cu from 65m
The South Boundary zone is directly west of the current Mount Milligan Southern Star pit, extending up to 600 metres southwest of the current mining operations. Mineralization is associated with transitional to late-stage veins including pyrite stringers and semi-massive pyrite ± magnetite veins spatially related to narrow faults and breccia in volcanic rocks with quartz-sericite-pyrite-carbonate (“QSPC”) alteration. Mineralization is also hosted in narrow faulted and brecciated monzonite porphyry dykes with early stage potassic alteration and associated veins that have been overprinted by the QSPC assemblage and later stage veins. Drill results at the South Boundary zone show series of high-grade gold values. This relatively shallow HGLC-style mineralization has the potential to support a satellite pit west of the current operation. Significant results include:
Hole #25-1604: 13.8m @ 7.19 g/t Au, 0.162% Cu from 192m
Hole #25-1604: 5.0m @ 3.59 g/t Au, 0.013% Cu from 316m
Hole #25-1604: 15.2m @ 0.72 g/t Au, 0.060% Cu from 156m
Hole #25-1597: 24.7m @ 1.29 g/t Au, 0.020% Cu from 13m
Hole #25-1579: 13.7m @ 1.36 g/t Au, 0.038% Cu from 8m
Hole #25-1579: 6.6m @ 1.85 g/t Au, 0.070% Cu from 48m
Hole #25-1601: 13.0m @ 1.62 g/t Au, 0.041% Cu from 163m
Hole #25-1590: 18.0m @ 1.02 g/t Au, 0.017% Cu from 238m
Hole #25-1644: 14.0m @ 1.27 g/t Au, 0.081% Cu from 226m
Hole #25-1644: 5.0m @ 2.45 g/t Au, 0.073% Cu from 207m
Hole #25-1595: 55.0m @ 0.27 g/t Au, 0.086% Cu from 20m
Hole #25-1595: 33.9m @ 0.36 g/t Au, 0.031% Cu from 173m
Hole #25-1647: 35.2m @ 0.39 g/t Au, 0.060% Cu from 69m
Hole #25-1592: 5.0m @ 2.69 g/t Au, 0.013% Cu from 131m
Hole #25-1582: 11.9m @ 1.10 g/t Au, 0.097% Cu from 18m
Hole #25-1639: 24.0m @ 0.48 g/t Au, 0.021% Cu from 283m
Hole #25-1639: 7.5m @ 1.38 g/t Au, 0.023% Cu from 52m
Hole #25-1587: 18.4m @ 0.56 g/t Au, 0.071% Cu from 24m
The plan for 2026 is to continue to infill the northern and western rims of the reserve pit and explore the western margins of the resource shell to upgrade inferred resources to indicated between Goldmark and North Slope and to expand resources at Goldmark, Saddle West and Boundary areas.
Kemess Project
- In 2025, 83 drillholes over 27,757 metres were completed in the proposed Kemess Main open pit area. The holes were planned to infill resources areas within the Kemess Main open pit and Kemess Underground and to expand the resource within Nugget, Central Ridge and Offset zones. Results indicate the continuation of mineralization within the resource pit and within the Nugget and Kemess Main open pit areas. Results from the Offset drilling also show the potential to delineate a resource at Offset.
- The western end of the Kemess South pit was drilled to test for potential mineralization west of the Kemess South bounding fault. A total of 4,178 metres across 10 holes was completed. Core logging confirmed the previously interpreted location of the north and west faults.
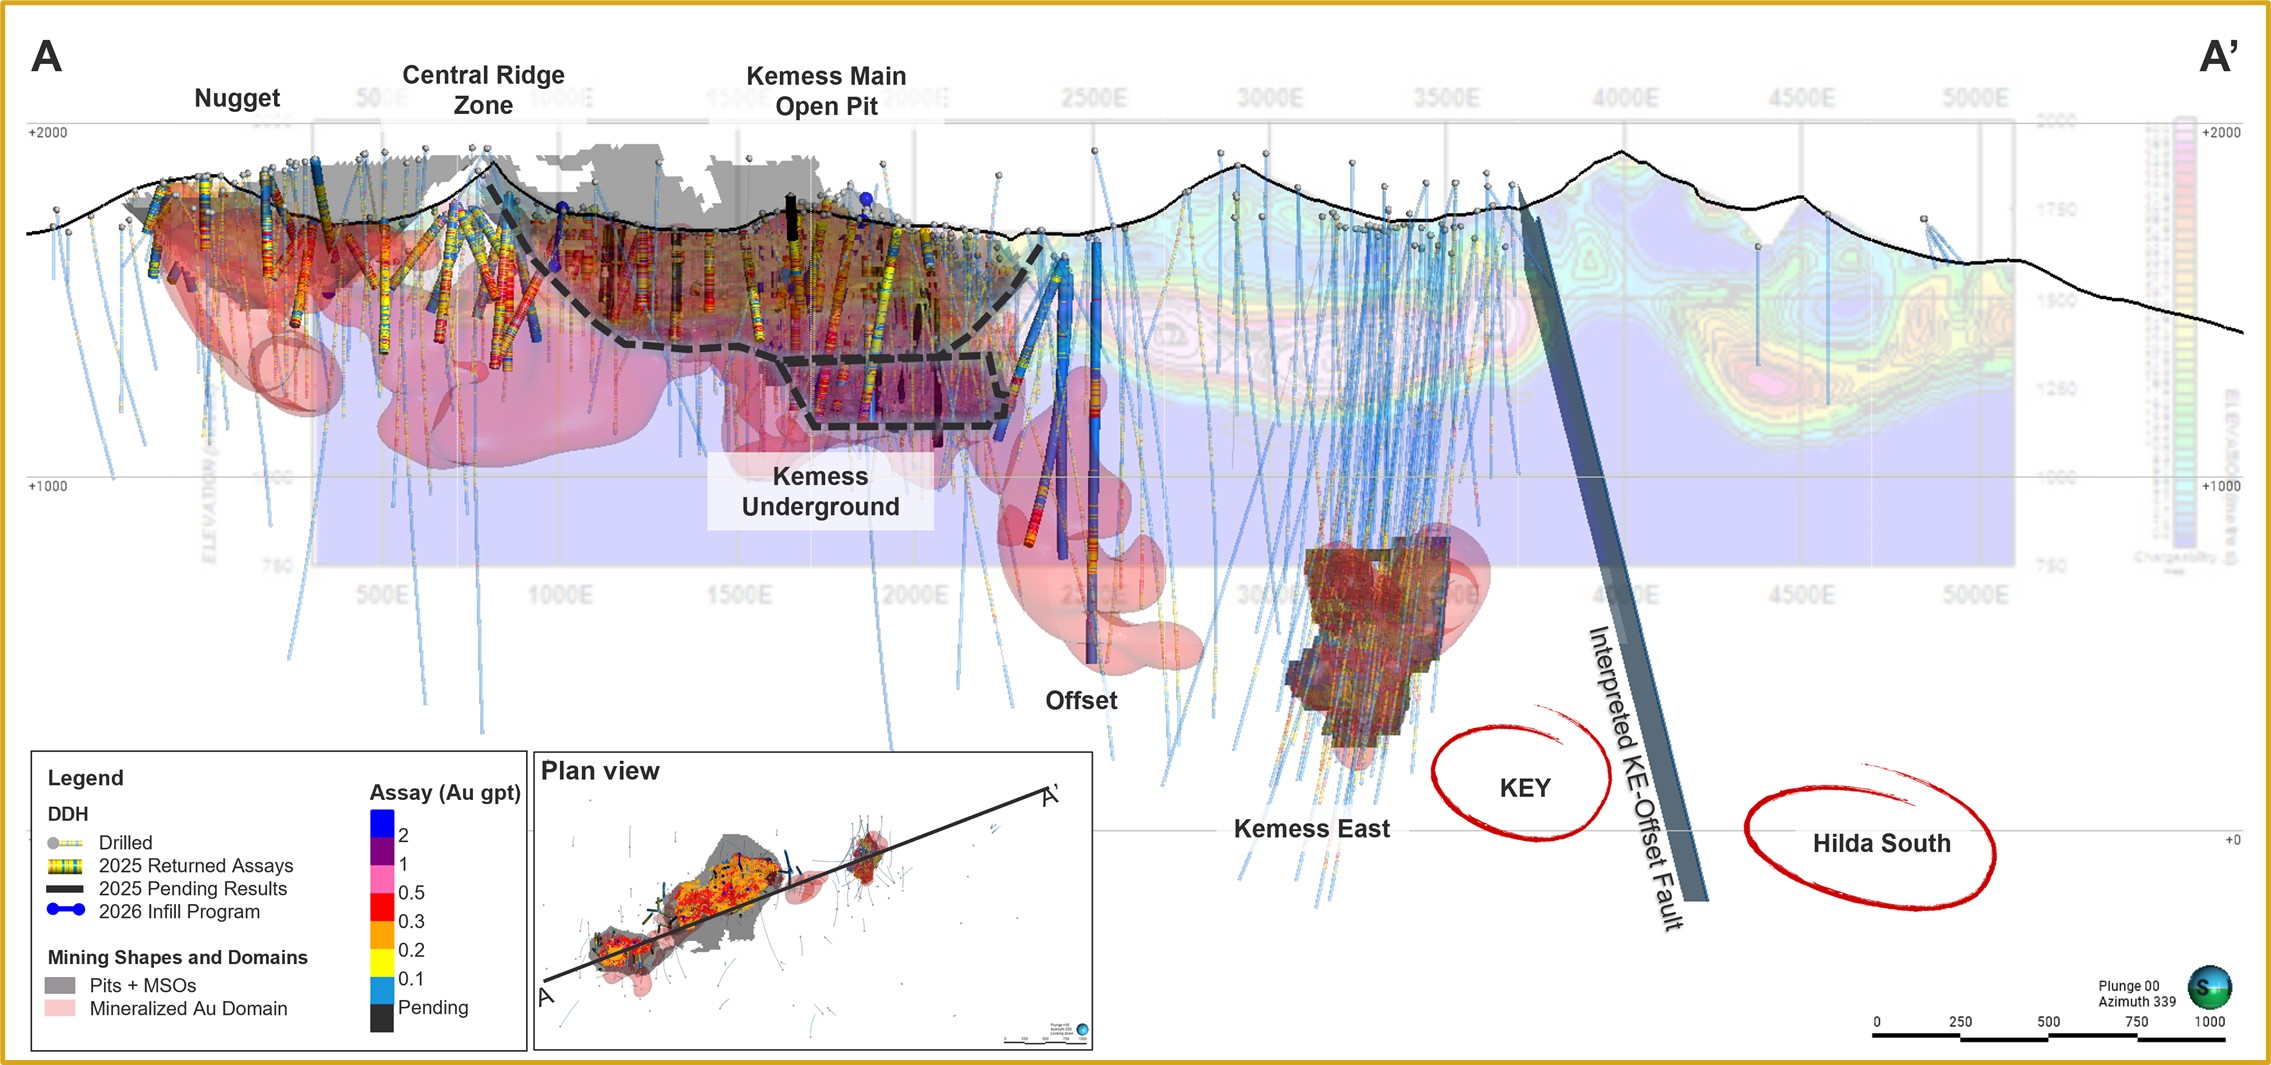
- Centerra is encouraged by extensive mineralization at Kemess and believes that it can be a future source of gold and copper production with a long mine life. The PEA results, published on January 19, 2026, only evaluated the Kemess Main and Kemess Underground area which represent approximately 47% of the total indicated and inferred resource tonnes.
Figure 3: A long sectional view of the Kemes deposit showing a 0.2 g/t Au shell. The dotted line in the figure represents approximately 47% of the total resource that used for the Kemess PEA
The Kemess Main Open Pit and Kemess Underground areas extend over 2.5 kilometres east-west, and 600 metres north-south. The deposit consists of a low-grade mineralized zone that extends from surface to a depth of zero to 300 metres below the surface on its western flank, including the Nugget zone and Kemess Open Pit, and a higher-grade zone with values greater than 0.5% grams gold per tonne and 0.5% copper from 300 to 550 metres below surface on the eastern side, which is the focus of the Kemess Underground deposit. The highest-grade mineralization of the Kemess Underground deposit is centered on a Black Lake suite porphyritic monzodiorite to diorite intrusion that dips shallow to moderately south. Assay results from 2025 infill drilling show wide intervals of shallow gold and copper mineralization. In the western portion of the deposit, the upper approximately 300 metres comprises phyllic altered volcanic rocks with underlying potassically altered volcanic rocks, both domains host copper-gold mineralization. Significant results received from the 2025 drilling include:
Hole #KN-25-011: 297.0m @ 0.33 g/t Au, 0.154% Cu from 5m
Hole #KN-25-014: 225.0m @ 0.39 g/t Au, 0.169% Cu from 2m
Hole #KN-25-016: 222.1m @ 0.42 g/t Au, 0.210% Cu from 5m
Hole #KN-25-020: 267.0m @ 0.49 g/t Au, 0.234% Cu from 8m
Hole #KN-25-023: 222.0m @ 0.32 g/t Au, 0.163% Cu from 5m
Hole #KN-25-026: 273.0m @ 0.32 g/t Au, 0.146% Cu from 5m
Hole #KN-25-027: 264.0m @ 0.24 g/t Au, 0.132% Cu from 12m
Hole #KN-25-029: 597.0m @ 0.34 g/t Au, 0.189% Cu from 5m
Hole #KN-25-042: 549.0m @ 0.41 g/t Au, 0.207% Cu from 2m
Hole #KN-25-045: 425.1m @ 0.39 g/t Au, 0.152% Cu from 10m
Hole #KN-25-048: 384.0m @ 0.28 g/t Au, 0.148% Cu from 18m
Hole #KN-25-049: 394.4m @ 0.33 g/t Au, 0.157% Cu from 6m
Hole #KN-25-053: 319.0m @ 0.30 g/t Au, 0.151% Cu from 6m
Hole #KN-25-055: 200.7m @ 0.36 g/t Au, 0.155% Cu from 140m
Hole #KN-25-056: 195.0m @ 0.33 g/t Au, 0.140% Cu from 5m
Hole #KN-25-057: 452.1m @ 0.29 g/t Au, 0.185% Cu from 59m
Hole #KN-25-061: 300.4m @ 0.25 g/t Au, 0.167% Cu from 81m
Hole #KN-25-081: 241.0m @ 0.27 g/t Au, 0.160% Cu from 5m
The Nugget zone is located along the Kemess Main trend, approximately 1.5 kilometres west of the Kemess Underground deposit. The more distal, lower-temperature gold ± copper mineralization is hosted by Takla rocks that were intruded by dykes belonging to the Black Lake intrusive suite. Dykes are between 10 to 100 metres wide and are generally associated with weaker alteration of the host rocks than alteration at Kemess Underground. The 2025 exploration drilling at Nugget continued to expand shallow porphyry mineralization, with varying gold to copper ratios, typically high gold to low copper hosted in volcanic rocks, with an increasing gold to copper ratio moving west. Significant results include:
Hole #KN-25-001: 120.9m @ 0.46 g/t Au, 0.092% Cu from 180m
Hole #KN-25-003: 110.0m @ 0.35 g/t Au, 0.113% Cu from 192m
Hole #KN-25-005: 206.5m @ 0.36 g/t Au, 0.077% Cu from 170m
Hole #KN-25-007: 214.0m @ 0.46 g/t Au, 0.089% Cu from 92m
Hole #KN-25-012: 217.4m @ 0.27 g/t Au, 0.033% Cu from 69m
Hole #KN-25-025: 166.6m @ 0.39 g/t Au, 0.072% Cu from 4m
Hole #KN-25-028: 215.7m @ 0.45 g/t Au, 0.072% Cu from 6m
Hole #KN-25-031: 166.0m @ 0.44 g/t Au, 0.088% Cu from 6m
Hole #KN-25-034: 243.0m @ 0.27 g/t Au, 0.129% Cu from 164m
Hole #KN-25-036: 180.0m @ 0.27 g/t Au, 0.098% Cu from 131m
Hole #KN-25-039: 163.2m @ 0.40 g/t Au, 0.108% Cu from 27m
Hole #KN-25-040: 399.0m @ 0.30 g/t Au, 0.095% Cu from 101m
Hole #KN-25-043: 132.0m @ 0.47 g/t Au, 0.101% Cu from 21m
Hole #KN-25-044: 330.0m @ 0.32 g/t Au, 0.103% Cu from 138m
Hole #KN-25-047: 289.8m @ 0.36 g/t Au, 0.080% Cu from 18m
Hole #KN-25-050: 271.9m @ 0.24 g/t Au, 0.052% Cu from 16m
Hole #KN-25-060: 379.5m @ 0.38 g/t Au, 0.148% Cu from 16m
During 2026, Centerra is expected to complete the infill drilling in the Kemess Main zone, as well as at the Kemess Offset zone to help bridge the mineralization gap between Kemess Underground and Kemess East. Beyond Kemess East, additional exploration potential exists along the eastern extension of the Kemess Main mineralization trend, including the KEY and Hilda South targets.
The KEY zone is interpreted to represent an eastern extension of the Kemess East system. Historic shallow drilling at Hilda South has intersected anomalous arsenic, zinc, and lead values which mirror the geochemical signature found above the main mineralized zone at Kemess East. Step-out drilling along this trend, extending eastward from Kemess East, could define better future exploration targets.
Goldfield and Oakley
- In 2025, drilling at the Goldfield and Oakley projects was delayed to mid-December 2025 due to permit timing and securing drill contracts. Approximately 13,320 metres of drilling was completed on the Callisto area at Goldfield, and 3,150 metres was completed at Oakley.
- At Goldfield, drilling at Callisto intersected the preferential Kendall Tuff lithology and mineralization but the latter appears to be dominated by sulfides.
- At Oakley, drilling at the Cold Hill prospect intersected several mineralized zones in the southern portion of the prospect in the preferential conglomerate host. Two of the holes returned significant intercepts including 15 metres with a grade of 2.38 g/t Au in hole CC25R06 and 61 metres with a grade of 0.45 g/t Au in hole CC25R07.
- Centerra will continue to test-drill for potential oxide mineralization within the Goldfield district and expediate exploration work at the newly staked land 6 km west of the Gemfield pit.
Öksüt and Türkiye
- A core drilling program was carried out at the Öksüt mine site, southeast of the Güneytepe pit to test for oxide gold potential at the Yelibelen target. However, no significant results were obtained from these drillholes.
- Drilling was carried out at the Ulu West license where a total of 2,061 metres of core drilling was completed for the year. The mineralization represents the southwestern extension of the orogenic Ulu gold system. The Ulu West licence covers a well-developed mineralized corridor characterized by consistent gold mineralization, representing a clear geological and structural trend within the broader Ulu system. A preliminary bottle roll test for samples collected from the drilling returned gold recoveries exceeding 90%. The mineralization continues northward into the Ulu joint venture license area, forming a continuous mineralized corridor.
- During 2026, Centerra will begin work to identify potential oxide mineralized targets in the vicinity of Öksüt, that will be drilled throughout the year and will also investigate the potential porphyry copper-gold ± supergene/hypogene copper at depth. These findings will be included in the Life of Mine Optimization Study that Centerra is expected to release at the end of 2026.
A full listing of the drill results has been filed on SEDAR+ at www.sedarplus.ca, EDGAR at www.sec.gov/edgar, and is available on the Company’s website at www.centerragold.com.
Centerra Gold 2025 Year-End Mineral Reserve Summary(1) as at December 31, 2025
(see additional footnotes below)
| Centerra Gold Inc. Mineral Reserve Summary | ||||||||||
| Mass | Grade | Contained Metal | ||||||||
| Tonnes (kt) | Au g/t | Ag g/t | Cu % | Mo % | Au koz | Ag koz | Cu Mlbs | Mo Mlbs | ||
| Mount Milligan(2) | ||||||||||
| Proven | 179,919 | 0.31 | 0.17 | 1,773 | 666 | |||||
| Probable | 290,413 | 0.27 | 0.16 | 2,522 | 1,050 | |||||
| Proven + Probable | 470,332 | 0.28 | 0.17 | 4,294 | 1,716 | |||||
| Öksüt | ||||||||||
| Proven | 827 | 0.73 | 20 | |||||||
| Probable | 14,527 | 1.04 | 484 | |||||||
| Proven + Probable | 15,355 | 1.02 | 503 | |||||||
| Goldfield | ||||||||||
| Proven | 9,944 | 1.04 | 334 | |||||||
| Probable | 23,404 | 0.49 | 372 | |||||||
| Proven + Probable | 33,348 | 0.66 | 706 | |||||||
| Thompson Creek | ||||||||||
| Proven | 44,885 | 0.076 | 75 | |||||||
| Probable | 68,104 | 0.057 | 86 | |||||||
| Proven + Probable | 112,989 | 0.065 | 161 | |||||||
(1) Centerra’s equity interests as of this news release are as follows: Mount Milligan 100%, Öksüt 100%, Goldfield 100% and Thompson Creek 100%. Mineral reserves and resources for these properties are presented on a 100% basis. Numbers may not add up due to rounding.
(2) Production at Mount Milligan is subject to a streaming agreement with RGLD Gold AG and Royal Gold, Inc. (collectively, “Royal Gold”) which entitles Royal Gold to 35% of gold sales and 18.75% of copper sales from Mount Milligan. Under the stream arrangement, Royal Gold will pay a reduced price per ounce of gold delivered. Mineral reserves and resources for the Mount Milligan property are presented on a 100% basis.
Centerra Gold 2025 Year-End Mineral Resource Summary(1,2,3) as at December 31, 2025
(see additional footnotes below)
| Centerra Gold Inc. Mineral Resource Summary | ||||||||||
| Mass | Grade | Contained Metal | ||||||||
| Tonnes (kt) | Au g/t | Ag g/t | Cu % | Mo % | Au koz | Ag koz | Cu Mlbs | Mo Mlbs | ||
| Mount Milligan(4) | ||||||||||
| Measured | 360,446 | 0.27 | 0.17 | 3,116 | 1,352 | |||||
| Indicated | 354,545 | 0.28 | 0.14 | 3,146 | 1,058 | |||||
| Measured + Indicated | 714,992 | 0.27 | 0.15 | 6,262 | 2,411 | |||||
| Inferred | 27,901 | 0.37 | 0.08 | 334 | 50 | |||||
| Öksüt | ||||||||||
| Measured | 11,773 | 1.02 | 385 | |||||||
| Indicated | 4,996 | 0.91 | 146 | |||||||
| Measured + Indicated | 16,769 | 0.98 | 530 | |||||||
| Inferred | 0 | 0.00 | 0 | |||||||
| Kemess Main - Open Pit | ||||||||||
| Measured | ||||||||||
| Indicated | 170,513 | 0.30 | 1.12 | 0.15 | 1,668 | 6,155 | 575 | |||
| Measured + Indicated | 170,513 | 0.30 | 1.12 | 0.15 | 1,668 | 6,155 | 575 | |||
| Inferred | 237,050 | 0.30 | 1.06 | 0.13 | 2,299 | 8,108 | 682 | |||
| Kemess South – Open Pit | ||||||||||
| Measured | ||||||||||
| Indicated | 13,204 | 0.37 | 0.68 | 0.13 | 158 | 289 | 38 | |||
| Measured + Indicated | 13,204 | 0.37 | 0.68 | 0.13 | 158 | 289 | 38 | |||
| Inferred | 198 | 0.34 | 0.42 | 0.08 | 2 | 3 | 0 | |||
| Kemess UG - Underground | ||||||||||
| Measured | ||||||||||
| Indicated | 33,223 | 0.82 | 2.48 | 0.36 | 877 | 2,652 | 265 | |||
| Measured + Indicated | 33,223 | 0.82 | 2.48 | 0.36 | 877 | 2,652 | 265 | |||
| Inferred | 20,094 | 0.74 | 2.22 | 0.33 | 481 | 1,433 | 148 | |||
| Kemess East - Underground | ||||||||||
| Measured | ||||||||||
| Indicated | 27,491 | 0.64 | 1.91 | 0.44 | 565 | 1,684 | 268 | |||
| Measured + Indicated | 27,491 | 0.64 | 1.91 | 0.44 | 565 | 1,684 | 268 | |||
| Inferred | 42,252 | 0.57 | 1.92 | 0.42 | 772 | 2,602 | 393 | |||
| Goldfield | ||||||||||
| Measured | 10,418 | 1.08 | 363 | |||||||
| Indicated | 26,616 | 0.50 | 432 | |||||||
| Measured + Indicated | 37,034 | 0.67 | 794 | |||||||
| Inferred | 2,121 | 0.33 | 23 | |||||||
| Thompson Creek | ||||||||||
| Measured | 50,522 | 0.074 | 83 | |||||||
| Indicated | 112,892 | 0.058 | 143 | |||||||
| Measured + Indicated | 163,415 | 0.063 | 226 | |||||||
| Inferred | 18,327 | 0.075 | 30 | |||||||
| Endako | ||||||||||
| Measured | 47,100 | 0.050 | 48 | |||||||
| Indicated | 122,175 | 0.040 | 118 | |||||||
| Measured + Indicated | 169,275 | 0.043 | 166 | |||||||
| Inferred | 47,325 | 0.040 | 44 | |||||||
(1) Centerra’s equity interests as of this news release are as follows: Mount Milligan 100%, Öksüt 100%, Kemess Main - Open Pit, Kemess South - Open Pit, Kemess UG – Underground, Kemess East - Underground 100%, Goldfield 100%, Thompson Creek 100% and Endako 75%. Mineral reserves and resources for these properties are presented on a 100% basis. Numbers may not add up due to rounding.
(2) Mineral resources are inclusive of mineral reserves. Mineral resources do not have demonstrated economic viability.
(3) Inferred mineral resources have a great amount of uncertainty as to their existence and as to whether they can be mined economically. It cannot be assumed that all or part of the inferred mineral resources will ever be upgraded to a higher category.
(4) Production at Mount Milligan is subject to a streaming agreement with Royal Gold which entitles Royal Gold to 35% of gold sale and 18.75% of copper sales from Mount Milligan. Under the stream arrangement, Royal Gold will pay a reduced price per ounce of gold delivered. Mineral reserves and resources for the Mount Milligan property are presented on a 100% basis.
Additional Footnotes
General
- Conversion factors used in the mineral resource and reserve estimates: 31.1035 grams per troy ounce; 2204.62 lbs per metric tonne; 0.9072 metric tonnes per short ton.
- Unless otherwise noted, an exchange rate of 1USD:1.33CAD was used for estimating resources and reserves.
Mount Milligan
- The mineral reserves are reported based on a gold price of $1,800 per ounce, a copper price of $3.75 per pound.
- The open pit mineral reserves are reported based on a Net Smelter Return (“NSR”) cut-off of $8.45 per tonne (C$11.24 per tonne) that considers metallurgical recoveries, concentrate grades, transportation costs, and smelter treatment charges to determine economic viability. Reserves include 31.7 million tonnes of marginal material to be processed at the end of mine life for closure purposes.
- The mineral resources are reported based on a gold price of $2,400 per ounce, a copper price of $4.00 per pound.
- The open pit mineral resources are constrained by a pit shell and are reported based on a NSR cut-off of $8.45 per tonne (C$11.24 per tonne) that considers metallurgical recoveries, concentrate grades, transportation costs, and smelter treatment charges to determine economic viability.
- Further information concerning the Mount Milligan deposit, operation, as well as environmental and other risks is described in Centerra’s most recently filed Annual Information Form which is available on SEDAR+ at www.sedarplus.ca and EDGAR at www.sec.gov/edgar and the Technical Report for the Mount Milligan PFS, with an effective date of June 30, 2025 (filed on October 17, 2025), which is available on SEDAR+ at www.sedarplus.ca.
Öksüt
- The mineral reserves are reported based on a gold price of $2,000 per ounce and an exchange rate of 1USD:42TL.
- The open pit mineral reserves are reported based on 0.20 grams of gold per tonne cut-off grade.
- Open pit optimization used an average life of mine (“LOM”) metallurgical recovery of 77%.
- The mineral resources are reported based on a gold price of $2,400 per ounce.
- Open pit mineral resources are constrained by a pit shell and are estimated based on a cut-off grade of 0.17 grams of gold per tonne.
- Further information concerning the Öksüt deposit, operation, as well as environmental and other risks is described in Centerra’s most recently filed Annual Information Form which is available on SEDAR+ at www.sedarplus.ca and EDGAR at www.sec.gov/edgar and the Technical Report on the Öksüt Project, dated September 3, 2015, which is available on SEDAR+ at www.sedarplus.ca.
Kemess
- The mineral resources are reported based on a gold price of $2,400 per ounce, a copper price of $4.00 per pound, a silver price of $25.00 per ounce.
- The Kemess Main open pit mineral resources (including the Nugget zone) are constrained by a pit shell and are reported based on a Net Smelter Return (“NSR”) cut-off of $12.01 per tonne (C$15.97 per tonne) that considers materials handling costs, metallurgical recoveries, concentrate grades, transportation costs, and smelter treatment charges to determine economic viability. A dilution factor of 0% and a mining recovery of 100% is used.
- The Kemess South open pit mineral resources are constrained by a pit shell and are reported based on a NSR cut-off of $9.98 per tonne (C$13.27 per tonne) that considers metallurgical recoveries, concentrate grades, transportation costs, and smelter treatment charges to determine economic viability. A dilution factor of 0% and a mining recovery of 100% is used.
- The Kemess Underground mineral resource is constrained by optimized stope shapes using commercially available software and reported with a NSR stope cut-off value of $41.71 per tonne (C$55.47 per tonne), representing the value required to cover mining, processing, general and administrative, and appropriate sustaining capital costs. Economic screening was performed on stope shapes to ensure reasonable prospects for eventual economic extraction. Dilution was estimated using equivalent linear overbreak sloughing (“ELOS”) for each stope type and ore-waste contacts, which vary between zero and 1.25 metres. Mining recovery of 93% was applied to all stopes.
- The Kemess East underground mineral resource is constrained by optimized stope shapes using commercially available software and reported with a NSR stope cut-off value of $41.71 per tonne (C$55.47 per tonne), representing the value required to cover mining, processing, general and administrative, and appropriate sustaining capital costs. Economic screening was performed on stope shapes to ensure reasonable prospects for eventual economic extraction. Dilution was estimated using ELOS for each slope type and ore-waste contacts, which vary between zero and 1.25 metres. Mining recovery of 93% was applied to all stopes.
- The Kemess Main open pit shell was restricted to a minimum floor elevation of 1,355 metres above sea level (“masl”) and the Kemess Underground optimized stope shapes were restricted to a maximum elevation of 1,355 masl, to represent the conceptual transition between open pit and underground mining zones for resource estimation purposes.
- A portion of the mineral resource estimate is included in the economic analysis for the PEA, which is limited to the Kemess Main open pit and Kemess Underground zones. This is a conservative subset that reflects mining, processing and economic assumptions. It is important to note that the PEA mining inventory is not a mineral reserve and does not demonstrate economic viability. The subset of the mineral resource used in the PEA was based on a gold price of $2,000 per ounce, a copper price of $3.75 per pound, a silver price of $22.50 per ounce.
Thompson Creek
- The mineral reserves are reported on a molybdenum price of $16.00 per pound.
- The open pit mineral reserves are based on a 0.030% molybdenum cut-off grade.
- The mineral resources are reported on a molybdenum price of $18.50 per pound.
- The open pit mineral resources are constrained by a pit shell and are estimated based on a 0.025% molybdenum cut-off grade.
- Further information concerning the Thompson Creek deposit, current and planned operations as well as environmental and other risks are described in the technical report with an effective date of September 1, 2024 and filed on SEDAR+ at www.sedarplus.ca.
Endako
- The mineral resources are reported based on a molybdenum price of $14.00 per pound and an exchange rate of 1USD:1.25CAD.
- The open pit mineral resources are constrained by a pit shell and are estimated based on a 0.025% molybdenum cut-off grade.
Goldfield
- The following formula was used to calculate cut-off grade for each mineralized zone: [Processing cost + G&A cost] / [Recovery * (Gold Price * Payability Factor * (1- Royalty%) – Selling Cost)] where G&A cost is $0.55/t, payability factor is 99.9% and selling cost is $5/oz.
Goldfield Reserves
- Mineral reserves are reported in metric tonnes based on a gold price of $2,000/oz.
- Mineral reserve estimates are supported by mineable pit designs, detailed LOM plan, equipment simulations, capital and operating cost estimates, and financial analysis.
- Mining Cost: A base mining cost of $3.47/t was applied with an incremental haulage costs of $0.31/t and $0.35/t applied to Goldfield Main and McMahon Ridge respectively. A general and administrative (“G&A”) cost of $0.55/t was applied for constraining the pit shell.
- Pit Slope Angles: Overall slope angles were assumed to be 35 degrees for all mineralized zones, except Goldfield Main which varied between 25 and 35 degrees depending on slope orientation.
- Processing Costs: Processing costs were estimated based on crushing and metallurgical testing. Processing costs for run-of-mine (“ROM”) material range from $3.03/t to $4.99/t. Processing costs for crushed material range from $5.06/t to $7.02/t.
- Recovery: Recoveries were estimated by laboratory testing of representative samples including bottle roll and column leach tests. Recoveries for ROM material range from 54% to 69%. Recoveries for crushed material range from 51% to 87%.
- Cut-off Grades: Cut-off grades for ROM material range from 0.10g/t to 0.16g/t. Cut-off grades for crushed material range from 0.12 g/t to 0.24 g/t.
- No dilution factor was applied as the selective mining unit (“SMU”) is expected to account for operational dilution and reflects the equipment sizing and capabilities.
- The Gemfield pit includes a volume of “must take” mineralized material (662,157 tonnes and 6,469 contained ounces) for permitting and closure purposes which lies outside the optimized pit shell. This material is included in the Gemfield reserve pit and economic analysis.
- Royalties applied: Gemfield 5%, Goldfield Main 4%, Jupiter 2.9%, McMahon Ridge 3%
Goldfield Resources
- Mineral resources are reported in metric tonnes based on a gold price of $2,400/oz.
- The open pit mineral resources are constrained by a pit shell and are reported based on cut-off grades reported below that take into consideration metallurgical recoveries and selling costs.
- Mining Cost: A base mining cost of $3.43/t was used with an incremental haulage costs of $0.31/t and $0.35/t applied to Goldfield Main and McMahon Ridge respectively. A G&A cost of $0.55/t was applied for constraining the pit shell.
- Processing Costs: Processing costs were estimated based on crushing and metallurgical testing. Processing costs for ROM material range from $3.03/t to $4.87/t. Processing costs for crushed material range from $5.35/t to $7.32/t.
- Cut-off Grades: Cut-off grades for ROM material range from 0.08 g/t to 0.12 g/t. Cut-off grades for crushed material range from 0.10 g/t to 0.20 g/t.
- No royalty costs were applied to the resource estimate.
- Sulphide Resources: Laboratory testing has shown that material classified as sulphide can be recovered from the Goldfield and McMahon Ridge zones with crushing. Processing costs, recoveries and cut-off grades for sulphide materials as follows – Goldfield Main: Crushed processing cost $9.59/t, recovery 51%, cut-off grade 0.26 g/t; McMahon Ridge: Crushed processing cost $7.89/t, recovery 37%, cut-off grade 0.30 g/t.
Qualified Person – Mineral Reserves and Resources
Christopher Richings, Professional Engineer, member of the Professional Engineers of Ontario and Engineers and Geoscientists British Columbia and Centerra’s Vice President, Technical Services, has reviewed and approved the scientific and technical information contained in this news release. Mr. Richings is a “qualified person” within the meaning of the Canadian Securities Administrator’s NI 43-101 Standards of Disclosure for Mineral Projects.
All mineral reserve and resources have been estimated in accordance with the standards of the Canadian Institute of Mining, Metallurgy and Petroleum and NI 43-101.
Mineral reserve and mineral resource estimates are forward-looking information and are based on key assumptions and are subject to material risk factors. If any event arising from these risks occurs, the Company’s business, prospects, financial condition, results of operations or cash flows, and the market price of Centerra’s shares could be adversely affected. Additional risks and uncertainties not currently known to the Company, or that are currently deemed immaterial, may also materially and adversely affect the Company’s business operations, prospects, financial condition, results of operations or cash flows, and the market price of Centerra’s shares. See the section entitled “Risk That Can Affect Centerra’s Business” in the Company’s annual Management’s Discussion and Analysis (MD&A) for the quarter-ended March 31, 2025, available on SEDAR+ at www.sedarplus.ca and EDGAR at www.sec.gov/edgar and see also the discussion below under the heading “Caution Regarding Forward-looking Information”.
Qualified Person & QA/QC – Exploration
Exploration information and related scientific and technical information in this document regarding the Mount Milligan Mine were prepared, reviewed, verified, and compiled in accordance with the standards of NI 43-101 by Cheyenne Sica, Member of the Association of Professional Geoscientists Ontario and Member of Engineers and Geoscientists British Columbia, and Exploration Manager at Centerra’s Mount Milligan Mine, who is the qualified person for the purpose of NI 43-101. Sample preparation, analytical techniques, laboratories used, and quality assurance and quality control protocols used during the exploration drilling programs are done consistent with industry standards while independent certified assay labs are used.
Exploration information and related scientific and technical information in this document regarding the Öksüt Mine, the Goldfield District Project, Oakley Project, and all other exploration projects were prepared, reviewed, verified, and compiled in accordance with the standards of NI 43-101 by Richard Adofo, Member of the Professional Association of Geoscientists Ontario and Vice President, Exploration & Resource at Centerra, who is the qualified person for the purpose of NI 43-101. Sample preparation, analytical techniques, laboratories used, and quality assurance and quality control protocols used during the exploration drilling programs are done consistent with industry standards while independent certified assay labs are used.
All other scientific and technical information presented in this document were prepared in accordance with the standards of the Canadian Institute of Mining, Metallurgy and Petroleum and NI 43-101 and were reviewed, verified, and compiled by Centerra’s geological and mining staff under the supervision of Christopher Richings, Professional Engineer, member of the Engineers and Geoscientists British Columbia and Centerra’s Vice President, Technical Services who is a qualified person for the purpose of NI 43-101.
About Centerra Gold
Centerra Gold Inc. is a Canadian-based gold mining company focused on operating, developing, exploring and acquiring gold and copper properties in North America, Türkiye, and other markets worldwide. Centerra operates two mines: the Mount Milligan Mine in British Columbia, Canada, and the Öksüt Mine in Türkiye. The Company also owns the Kemess Project in British Columbia, Canada, the Goldfield Project in Nevada, United States, and owns and operates the Molybdenum Business Unit in the United States and Canada. Centerra’s shares trade on the Toronto Stock Exchange (“TSX”) under the symbol CG and on the New York Stock Exchange (“NYSE”) under the symbol CGAU. The Company is based in Toronto, Ontario, Canada.
For more information:
Lisa Wilkinson
Vice President, Investor Relations & Corporate Communications
(416) 204-3780
Lisa.Wilkinson@centerragold.com
Additional information on Centerra is available on the Company’s website at www.centerragold.com, on SEDAR+ at www.sedarplus.ca and EDGAR at www.sec.gov/edgar.
Caution Regarding Forward-Looking Information
This news release contains or incorporates by reference “forward-looking statements” and “forward-looking information” as defined under applicable Canadian and U.S. securities legislation. All statements, other than statements of historical fact, which address events, results, outcomes or developments that the Company expects to occur are, or may be deemed to be, forward-looking statements. Such forward-looking information involves risks, uncertainties and other factors that could cause actual results, performance, prospects and opportunities to differ materially from those expressed or implied by such forward-looking information. Forward-looking statements are generally, but not always, identified by the use of forward-looking terminology such as “assume”, “believes”, “continue”, “encouraged”, “estimate”, “expect”, “future”, “ongoing”, “plan”, “potential”, “target” or “update”, or variations of such words and phrases and similar expressions or statements that certain actions, events or results “may”, “could”, “would” or “will” be taken, occur or be achieved or the negative connotation of such terms. Such statements include but may not be limited to: mineral reserve and mineral resource estimates; future exploration potential; timing and scope of future exploration (brownfields or greenfields); the ability of the Company to increase mineral reserves or mineral resources at any of its properties; and other statements that express management’s expectations or estimates of future plans and performance, operational, geological or financial results, estimates or amounts not yet determinable and assumptions of management.
The Company cautions that forward-looking statements are necessarily based upon a number of factors and assumptions that, while considered reasonable by the Company at the time of making such statements, are inherently subject to significant business, economic, technical, legal, political and competitive uncertainties and contingencies. Known and unknown factors could cause actual results to differ materially from those projected in the forward-looking statements and undue reliance should not be placed on such statements and information.
Market price fluctuations in gold, copper, and other metals, as well as increased capital or production costs or reduced recovery rates may render ore reserves containing lower grades of mineralization uneconomic and may ultimately result in a restatement of mineral reserves. The extent to which mineral resources may ultimately be reclassified as proven or probable mineral reserves is dependent upon the demonstration of their profitable recovery. Economic and technological factors, which may change over time, always influence the evaluation of mineral reserves or mineral resources. Centerra has not adjusted mineral resource figures in consideration of these risks and, therefore, Centerra can give no assurances that any mineral resource estimate will ultimately be reclassified as proven and probable mineral reserves.
Mineral resources are not mineral reserves, and do not have demonstrated economic viability, but do have reasonable prospects for economic extraction. Measured and indicated mineral resources are sufficiently well defined to allow geological and grade continuity to be reasonably assumed and permit the application of technical and economic parameters in assessing the economic viability of the resource. Inferred mineral resources are estimated on limited information not sufficient to verify geological and grade continuity or to allow technical and economic parameters to be applied. Inferred mineral resources are too speculative geologically to have economic considerations applied to them to enable them to be categorized as mineral reserves. There is no certainty that mineral resources of any category can be upgraded to mineral reserves through continued exploration.
Centerra’s mineral reserve and mineral resource figures are estimates, and Centerra can provide no assurances that the indicated levels of gold or copper will be produced, or that Centerra will receive the metal prices assumed in determining its mineral reserves. Such estimates are expressions of judgment based on knowledge, mining experience, analysis of drilling results, and industry practices. Valid estimates made at a given time may significantly change when new information becomes available. While Centerra believes that these mineral reserve and mineral resource estimates are well established, and the best estimates of Centerra’s management, by their nature mineral reserve and mineral resource estimates are imprecise and depend, to a certain extent, upon analysis of drilling results and statistical inferences, which may ultimately prove unreliable. If Centerra’s mineral reserve or mineral reserve estimates for its properties are inaccurate or are reduced in the future, this could have an adverse impact on Centerra’s future cash flows, earnings, results, or operations and financial condition.
Centerra estimates the future mine life of its operations. Centerra can give no assurance that mine life estimates will be achieved. Failure to achieve these estimates could have an adverse impact on Centerra’s future cash flows, earnings, results of operations, and financial condition.
Additional risk factors and details with respect to risk factors that may affect the Company’s ability to achieve the expectations set forth in the forward-looking statements contained in this news release are set out in the Company’s latest 40-F/Annual Information Form and Management’s Discussion and Analysis, each under the heading “Risk Factors”, which are available on SEDAR+ (www.sedarplus.ca) or on EDGAR (www.sec.gov/edgar). The foregoing should be reviewed in conjunction with the information, risk factors and assumptions found in this news release.
The Company disclaims any intention or obligation to update or revise any forward-looking statements, whether written or oral, or whether as a result of new information, future events or otherwise, except as required by applicable law.
Photos accompanying this announcement are available at
https://www.globenewswire.com/NewsRoom/AttachmentNg/1c709074-e82b-4569-b153-d711e16f7373
https://www.globenewswire.com/NewsRoom/AttachmentNg/e9491909-8084-465c-a8ff-40842bedc6ce
https://www.globenewswire.com/NewsRoom/AttachmentNg/86ee8c0d-0c8c-4b5f-9b29-8f1dbf71ab28
A PDF accompanying this announcement is available at
http://ml.globenewswire.com/Resource/Download/b0c7bf6a-fb7d-4435-b3a2-ace27a261dc5

![]()